Name: Kuok Cheok Fai (郭卓暉)
School: Chan Sui Ki Perpetual Help College
In the 1950s, the central region of the United States experienced a catastrophe. Mosquitoes reproduced in local ponds and rivers, spreading diseases such as malaria and typhus through their bites. A solution was proposed by experts: adding DDT (dichloro-diphenyl-trichloroethane) to the ponds, a colourless, tasteless, and odourless insecticide. They anticipated that this method would suppress mosquito populations and halt the spread of disease by killing larvae in the water. However, a completely contrary outcome was observed. Although the mosquito population declined briefly, it subsequently surged, in some locations even surpassing pre-DDT levels. This counterintuitive phenomenon puzzled scientists at the time. Some religious authorities even attributed it to divine punishment. In reality, this phenomenon had already been investigated and explained by Lotka and Volterra in the 1920s, and is now known as Volterra’s principle.

This AI generated image recently provided by Kuok Cheok Fai shows a man being swarmed by mosquitoes.
In essence, as DDT was introduced into the ponds, the fish were killed due to its high toxicity (which is also one of the reasons DDT has been banned in recent years). Unfortunately, fish served as natural predators of mosquito larvae and played a crucial role in regulating mosquito populations. Therefore, although DDT temporarily reduced mosquito numbers, the increase in mosquitoes due to the decline in fish populations outweighed the decrease caused by DDT, resulting in a net increase in mosquito population. However, a purely qualitative explanation is insufficient; it is essential to elucidate this phenomenon in more rigorous, mathematical terms. Thus, constructing a mathematical model becomes necessary.
Several conditions must be considered, including the independent dynamics of each species and the interactions between them. We assume that the rate of change of each species is proportional to its population size. For prey, a larger population results in higher reproduction rates and thus an increased rate of growth. For predators, a larger population leads to more frequent deaths, resulting in a higher rate of decline. (One might ask why the death rate of prey and the reproduction rate of predators are not considered. This can be explained by the relative magnitudes of reproduction and mortality rates for each species: for prey, reproduction exceeds mortality, and vice versa for predators.) From this, we infer the following:
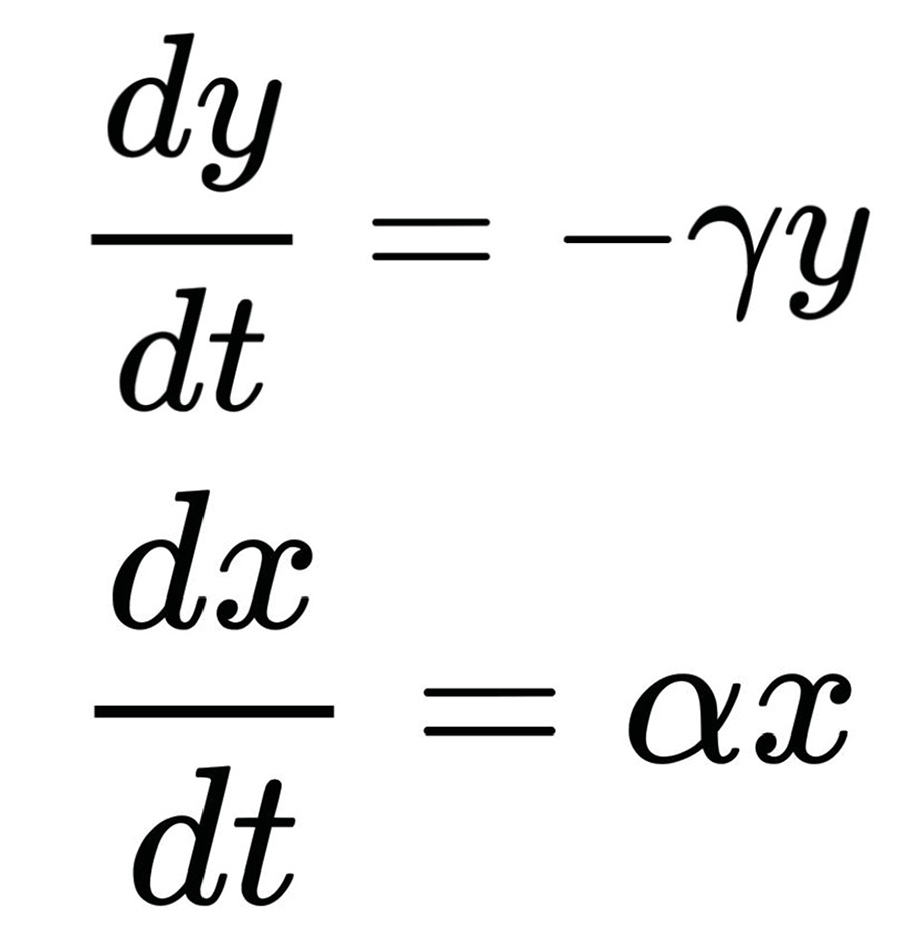
In these equations, the variables x and y denote the populations of prey and predators, respectively, while α and γ are positive constants. This aligns with our previous conclusions.
Taking interactions into account, we observe that a higher predator density increases the likelihood of prey being consumed, resulting in a higher decay rate of prey. Conversely, the same principle applies to predators due to the reciprocal relationship between the species. Therefore, the additional terms in the equations must be directly proportional to xy, leading to the final form:
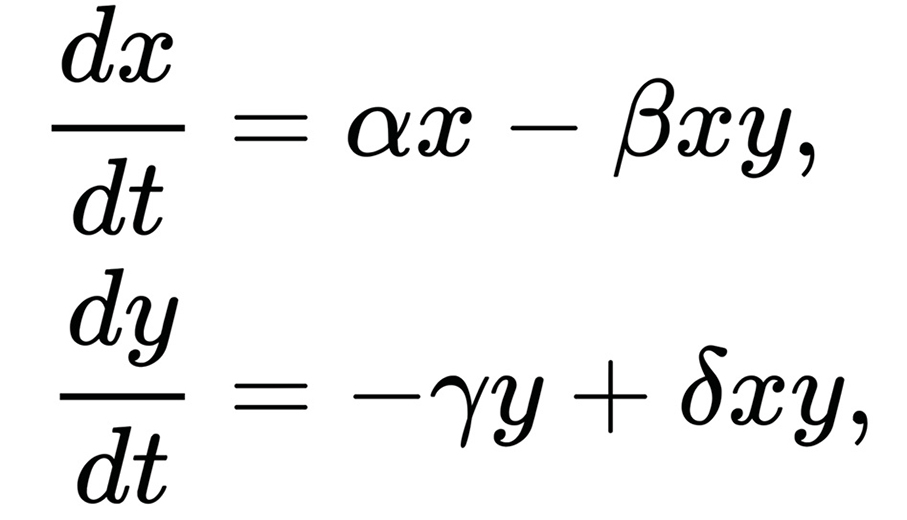
where β and δ are positive constants.
Understanding the interpretation of these equations, it is straightforward to identify the equilibrium points, where the populations of both prey and predators remain constant. Setting dx/dt and dy/dt to zero, we obtain two equilibrium points: (γ/δ, α/β) and (0,0). With these critical points, we can derive an analytical solution using the method of separation of variables, as detailed below:
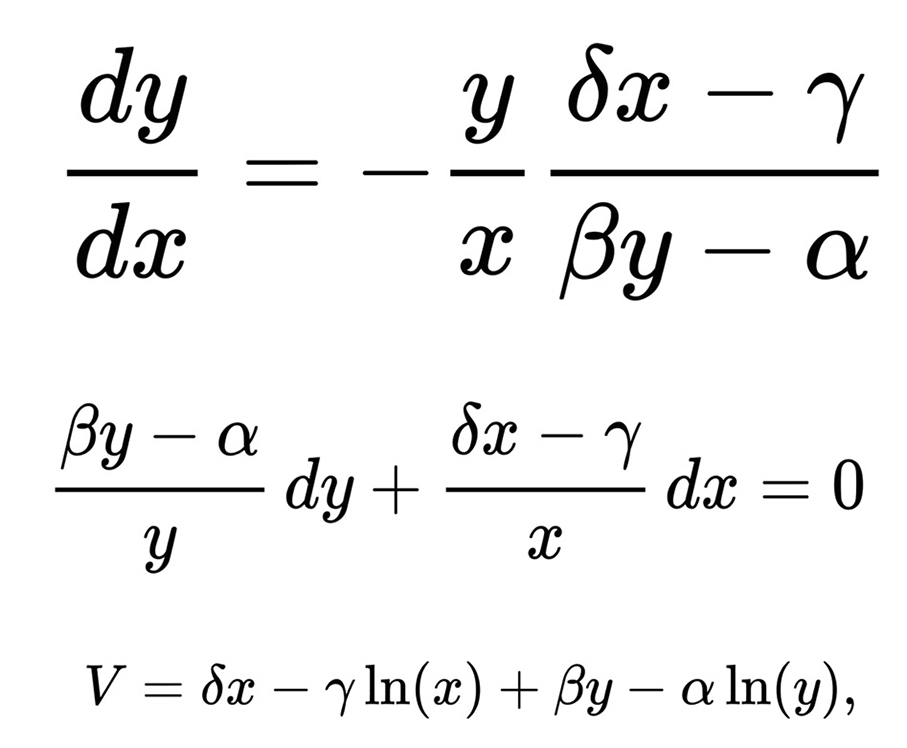
where V is a constant. With the analytical solutions, we can plot a corresponding phase diagram:
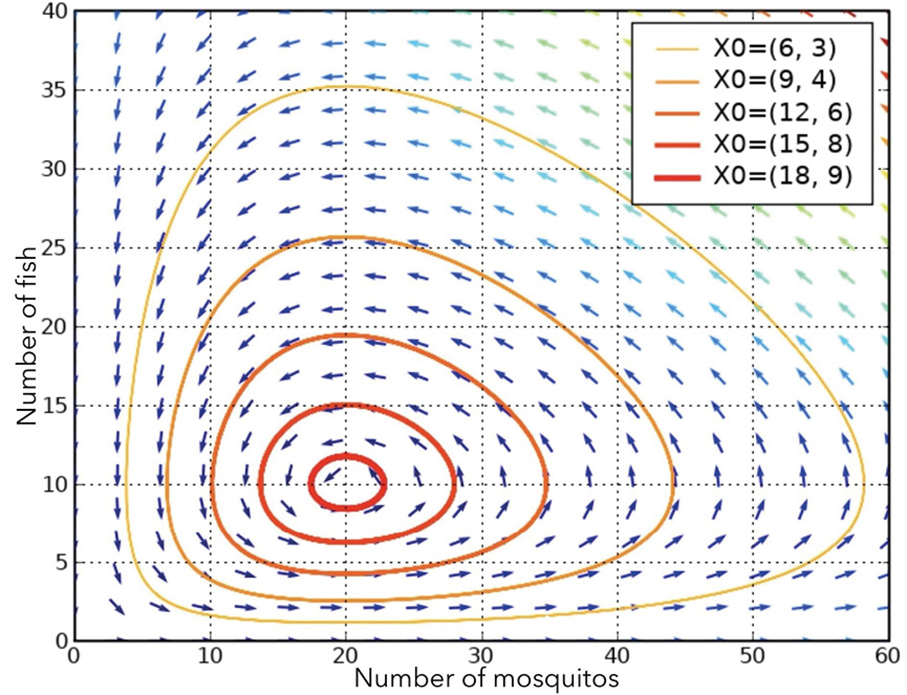
It is important to note that the arrows in the phase diagram represent the direction of time, indicating that each trajectory forms an anti-clockwise cycle. Furthermore, each solution curve is closed and revolves around the critical point (γ/δ, α/β). This can be demonstrated by interpreting the right-hand side of the solution as a function of x and y, so each solution curve corresponds to a contour of this function, necessarily forming a closed loop around the stationary point.
Having constructed such a sophisticated model, the answer to the initial question becomes evident. The addition of DDT effectively eliminates both fish and mosquitoes in a manner analogous to the natural population dynamics of each species. Specifically, a higher population leads to a higher rate of elimination. Accordingly, the equations can be modified by incorporating a negative term in each equation, representing population decline due to DDT exposure. Moreover, as previously discussed, these additional terms are directly proportional to the population of each respective organism, resulting in the system below:
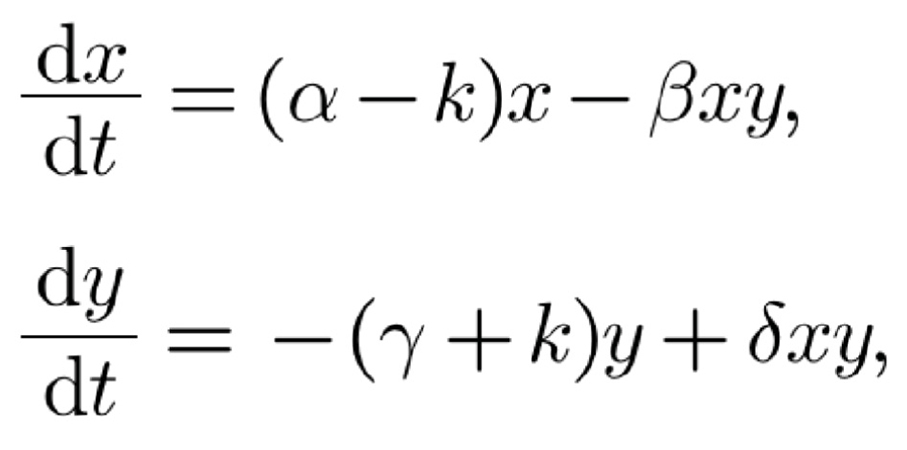
where k is a positive constant less than α, representing the mortality rate induced by DDT. This modification shifts the equilibrium point from (γ/δ, α/β) to ((γ+k)/δ, (α-k)/β). As a result, the critical point moves to a location corresponding to more mosquitoes and fewer fish. The new solution curves revolve around this altered stationary point and produce a biological cycle characterised by a dramatic surge in mosquito population following the introduction of DDT, which is highly toxic and thus associated with a large k.
From this historical episode, we can conclude that counterintuitive phenomena in nature are not necessarily manifestations of the supernatural. Employing mathematical or experimental approaches enables humanity to decipher the metaphor of each natural breeze, thereby affirming the existence and uniqueness of rational and critical cognition, and offering individuals the qualification to the heaven of wisdom.
Sources:
https://ocw.mit.edu/courses/18-03sc-differential-equations-fall-2011/
https://en.wikipedia.org/wiki/Lotka–Volterra_equations
https://scipy-cookbook.readthedocs.io/items/LoktaVolterraTutorial.html